Matador Resources (MTDR)·Q4 2025 Earnings Summary
Matador Resources Beats on Record Production, Guides to Capital Efficiency in 2026
February 24, 2026 · by Fintool AI Agent
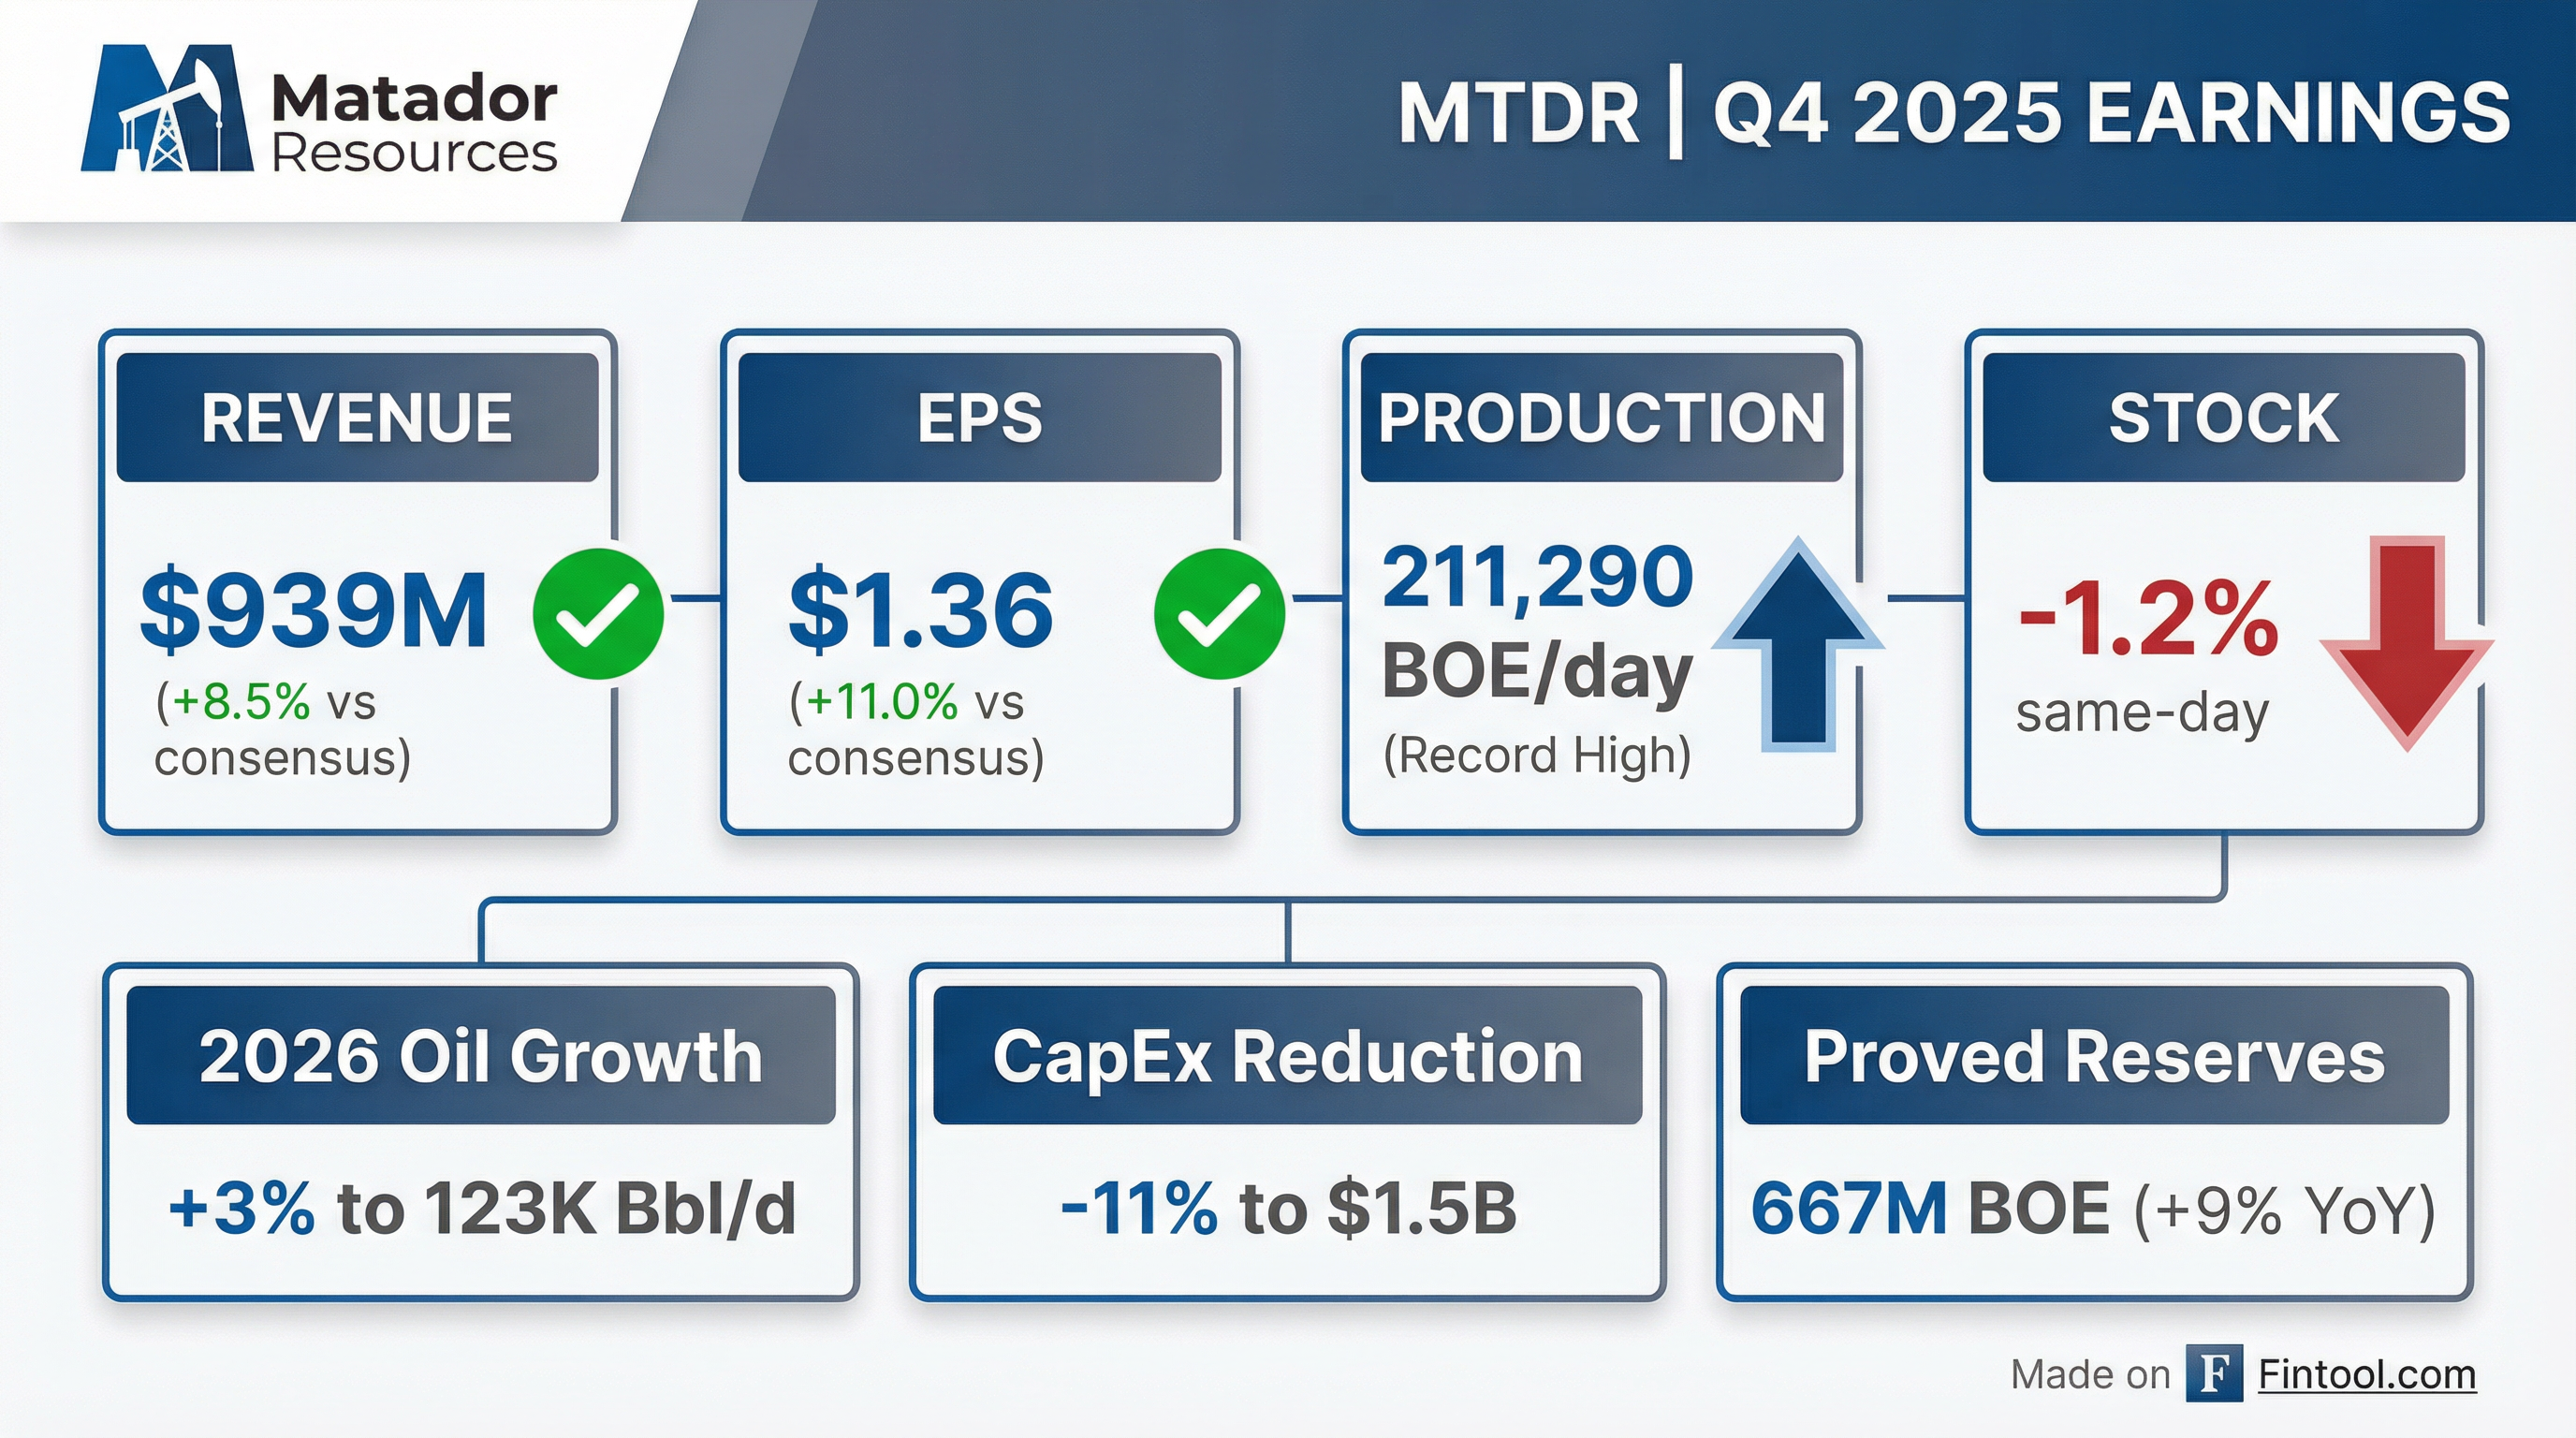
Matador Resources (NYSE: MTDR) delivered a double beat in Q4 2025, posting record quarterly production while signaling a pivot toward capital discipline in 2026. Revenue of $939M topped consensus by 8.5%, and adjusted EPS of $1.36 exceeded estimates by 11.0%—marking the Delaware Basin operator's eighth consecutive quarterly EPS beat.
The stock traded down ~1.2% on the day to $50.53, as investors digested lower Q1 2026 production guidance impacted by winter weather and Waha hub pricing headwinds. After-hours, shares recovered to $51.28.
Did Matador Beat Earnings?
Yes, a clear double beat. Matador exceeded estimates on revenue, EPS, and EBITDA while delivering record production volumes.
Values retrieved from S&P Global
The production outperformance came despite shutting in ~4,000 BOE/day due to weak natural gas pricing at the Waha hub.
Beat/Miss Streak: 8 Consecutive Quarters
Values retrieved from S&P Global
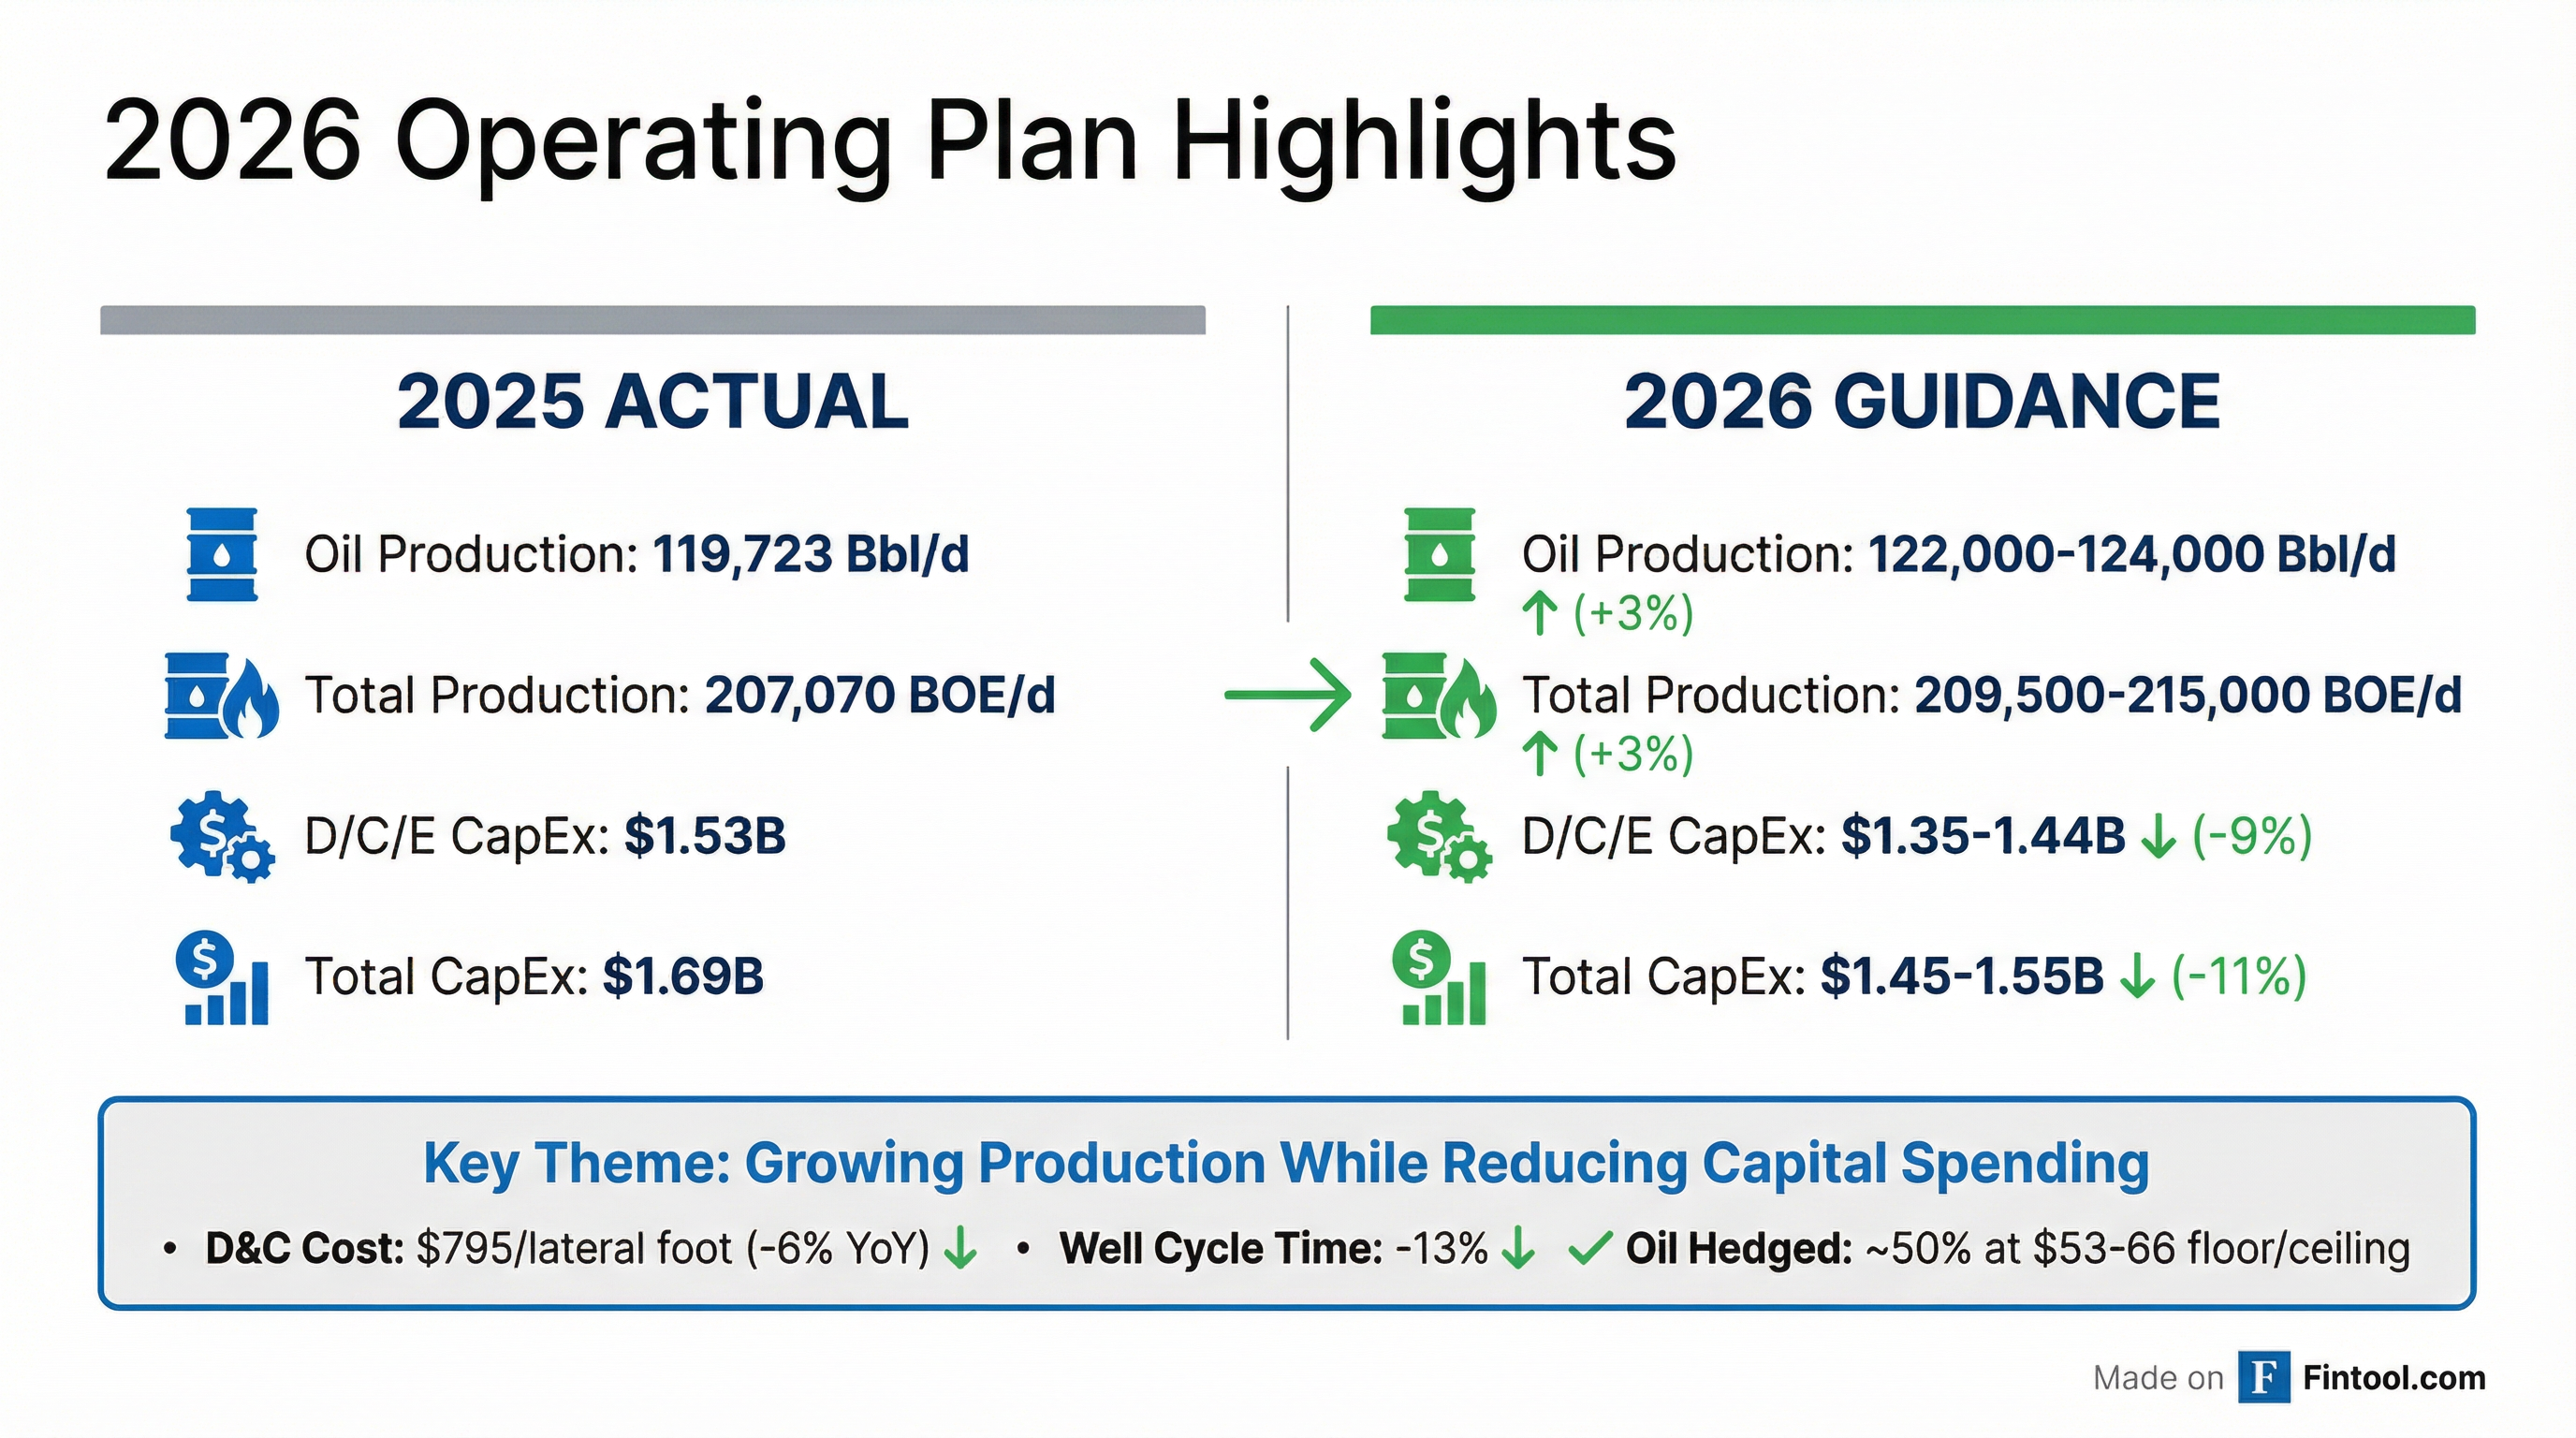
What Did Management Guide for 2026?
Management delivered a growth-at-lower-capital message: 3% oil production growth while cutting total CapEx by 11%.
Q1 2026: A Soft Start
Management guided Q1 2026 production significantly below Q4 2025 levels:
The sequential decline reflects three factors:
- Weather impacts: ~4,000 BOE/d shut-in during January winter storm Fern
- Waha pricing headwinds: ~3,000 BOE/d elective shut-ins
- Well timing: Only 11 of 34 net operated wells turned to sales by mid-February; remaining 23 expected in March
Management expects a "significant increase" beginning in Q2 2026 with steady gains through year-end.
What Changed From Last Quarter?
1. Hugh Brinson Pipeline Access (New Catalyst)
Matador secured 500 MMBtu/day of firm natural gas transportation on Energy Transfer's Hugh Brinson pipeline, expected to flow gas in Q3 2026 and be fully in-service by Q4 2026.
Why it matters: The pipeline provides direct access from Waha to Henry Hub, where 2025 pricing ran as much as $3/MMBtu higher than Waha. Each $0.50/MMBtu improvement would add ~$90M in annual revenue.
2. Midstream Strategic Transactions
Five Point (49% San Mateo owner) is moving its stake into a continuation vehicle, signaling potential for combining Matador's wholly-owned midstream assets with San Mateo.
Combined midstream Adjusted EBITDA grew to $332M in 2025 and is expected to reach $360M in 2026 (+8%).
3. Proved Reserves Hit Record
Total proved reserves reached 667.0 million BOE at December 31, 2025—up 9% from 611.5 million BOE a year earlier.
- Reserve replacement ratio: 173% (organic growth, not acquisitions)
- Finding & development costs: $10.34/BOE (down 6% from $10.98 in 2024)
- PV-10: $8.2 billion
Key Management Quotes
"2025 was another record year for Matador and San Mateo... Our strategic priorities for 2026 include improving capital efficiency, profitability and reduction in our RBL, midstream value realization, quality land acquisitions, reserves growth and decreased capital costs."
— Joseph Wm. Foran, Founder, Chairman & CEO
"The ability to achieve this 3% oil production growth profile while reducing capital expenses illustrates Matador's successful focus on operating efficiencies and inventory strength."
— Joseph Wm. Foran
How Did the Stock React?
MTDR closed at $50.53 on the earnings release day, down 1.2% from the prior close of $51.16. The muted reaction likely reflects:
- Q1 headwinds already known — Weather and timing impacts were previewed
- Waha exposure — Continued Permian gas price headwinds
- Valuation — Stock was already near 52-week highs ($54.20)
Historical Stock Performance Around Earnings
Financial Summary
Income Statement Highlights
Full Year 2025 Summary
Balance Sheet & Capital Allocation
2025 Shareholder Returns: $218.9M total
- Dividends: $163.1M
- Share repurchases: $55.8M ($400M program authorized)
Forward Catalysts
Consensus Estimates: Where Does the Street Stand?
Values retrieved from S&P Global
Key Risks & Concerns
-
Waha Gas Pricing — Permian natural gas basis differentials remain a headwind until Hugh Brinson pipeline comes online
-
Q1 2026 Production Step-Down — 4-5% sequential decline may weigh on near-term sentiment
-
Commodity Exposure — ~50% of 2026 oil hedged at $53-66 collars; downside protected but upside capped
-
Leverage — 1.1x Net Debt/EBITDA is manageable but above some peers
Bottom Line
Matador delivered another beat in Q4 2025, extending its EPS outperformance streak to eight quarters. The 2026 playbook is clear: grow oil production modestly while improving capital efficiency and cost structure. The Hugh Brinson pipeline remains the key catalyst for H2 2026, potentially unlocking $90M+ in incremental annual revenue from better gas realizations.
The Q1 2026 production dip is a near-term headwind, but management expects volume acceleration through the year. With proved reserves up 9%, finding costs down 6%, and a credible path to margin expansion, Matador is executing on its "measured pace" growth strategy.
Conference call: Wednesday, February 25, 2026 at 10:00 AM CT
Related Links: